
Half a Pattern: is a squad’s weakest position the right place to sign?
The hardest part of recruitment is knowing what to look for. Coherent sides produce certain qualities together, and many squads deliver one half of a pairing and not the other. That gap is often somewhere other than the weakest position.
Tal Darchi, Co-founder and Chief Data Scientist
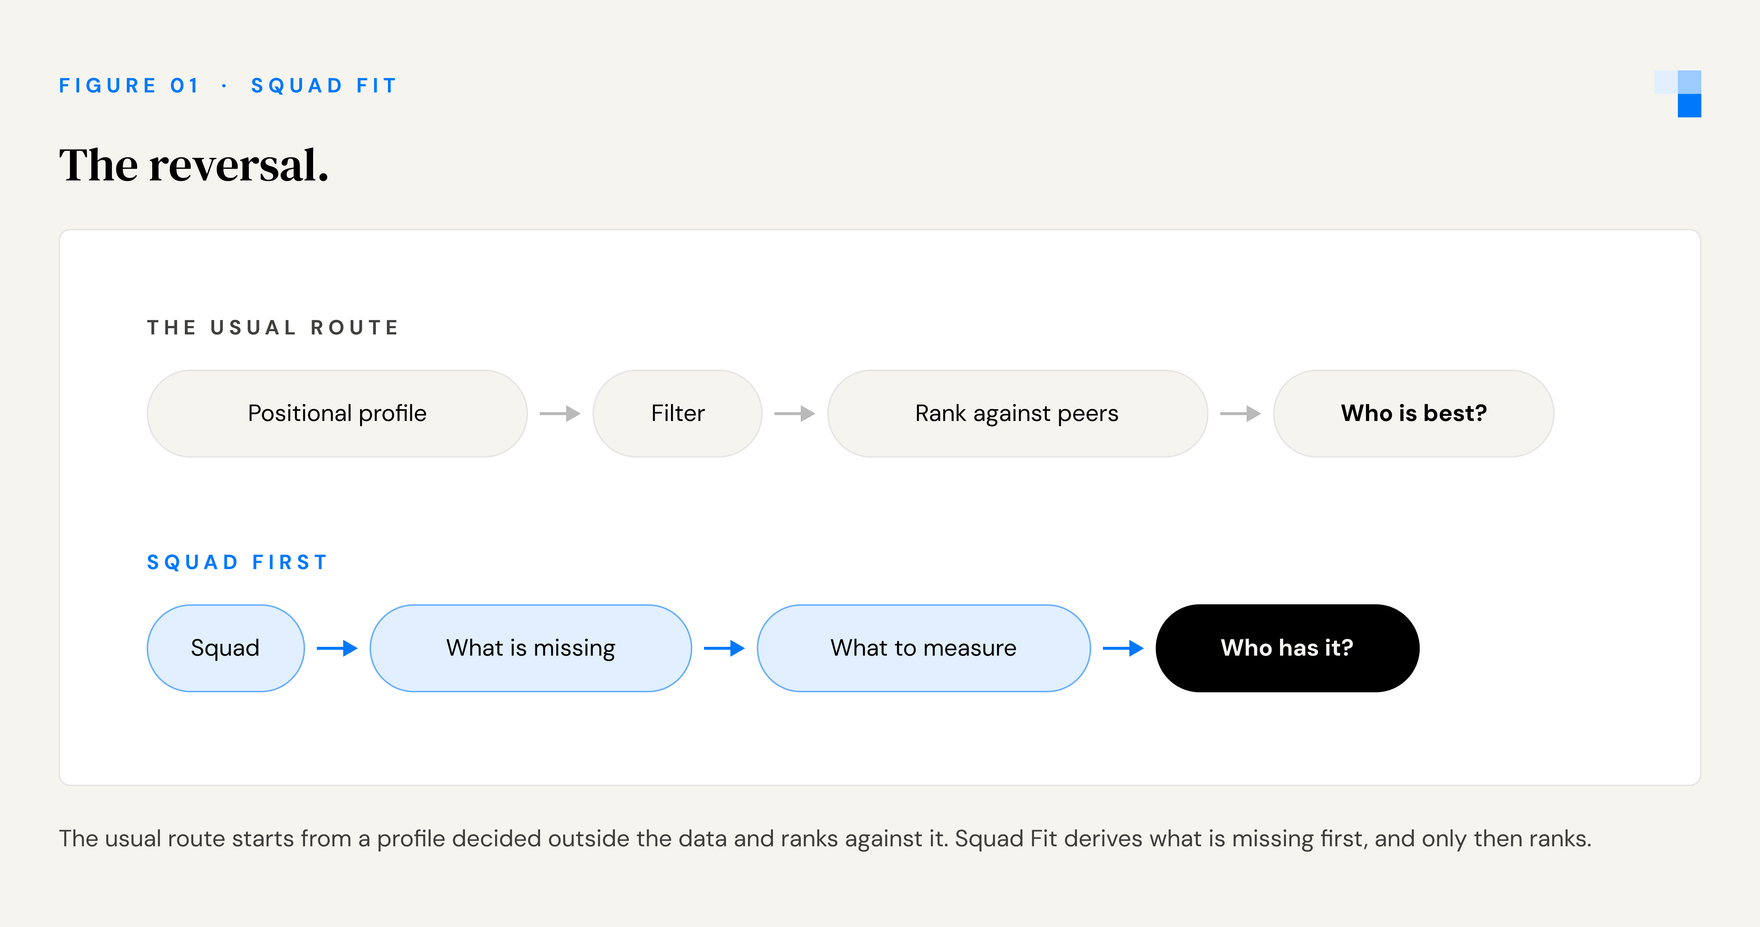
Measuring players with data has become very good. Positional profiles, indexes, grades and percentile radars all answer the same question, how good is he, and they answer it better every year. But every one of those tools has to be pointed at something first to answer how good that player is for your club. Someone decides the squad needs a deep-lying playmaker, or a ball-playing centre-back, and only then does the measurement begin. Clubs do analyze their own squads, and many do it well. What rarely happens, because it takes time and people that recruitment departments do not have, is deriving that brief from the squad’s own numbers end to end. In several hundred conversations with sporting directors, analysts and scouts, we have almost never seen it. The brief gets assembled instead from partial data, a coach’s read, a scouting report, a squad age profile, a conversation. The step that decides everything downstream is the step with the least measurement behind it.
SkillCorner’s recent piece on how to build a player index is a good illustration, and a good piece. It places the index at the search stage and is careful about the traps that catch people there: metrics that barely separate players, metrics that duplicate each other, and the temptation to keep adding more. Its worked example is a club brief for a number six playmaker with six requirements, and one player in 541 cleared the bar. The brief itself arrives from outside the data. That is normal, and it is not a criticism of the index. The index is downstream of a question, and the question came from somewhere else.
Marquee’s Squad Fit model starts at that question. It reads what a squad already produces, compares it against what coherent sides across world football produce, weighs that against how this particular team plays, and arrives at what the squad is short of before any player is ranked. That read is being built into Marq (our AI recruitment agent), so that when a club searches, the shortlist it gets back is already pointed at what the squad is missing rather than at general quality. It also works in the other direction. When a name arrives from an agent, an intermediary or a scout, the same read says whether that player answers something this squad is actually short of, before anyone spends real time on video. The ranking still happens, and it still uses positional percentiles. What changes is what those percentiles are pointed at.
Two reads from the model make the difference concrete.
Run the squad read on Manchester City and its first flag is tackling. City counter-press well and tackle far less than the standard expects of a side that does, because they have the ball for most of the match. A read against the worldwide standard alone would call that a weakness. A read that also asks how the team plays says the tackles are missing because City spend so little time without the ball. Nobody would tell City to sign a tackler, and the read should not suggest one.
Run it on Strasbourg and the two lenses disagree. Raw positional percentiles say the weakest players are the defenders: the centre-backs and full-backs sit lowest in the squad, and a ranking would send the club shopping for one. The squad read says otherwise. The team presses, wins the ball back and intercepts at or above the norm, and conceded like a mid-table side; much of what drags the defenders’ numbers down is tackles, which a side with the ball rarely needs, as City showed. The flag is in attack. Strasbourg score well above the norm, and sides that score that much usually make far more chances: their key passes sit below the norm. The obvious objection is that the goals are luck, a season of finishing above the chances. Partly, yes. But the chances were good ones: Strasbourg shoot no more often than most of the league and from better positions than almost all of it. So the read is not that the goals will dry up. It is that a side scoring this much from this few chances is short of the passes that make them. Signing the best available defender would have fixed a number. The read points at the passes instead, and at the positions where Strasbourg’s own players fall short of them. That is what the model is for. It names the need the goals were hiding, while the goals are still going in, and it tells the club what to measure the next signing on.
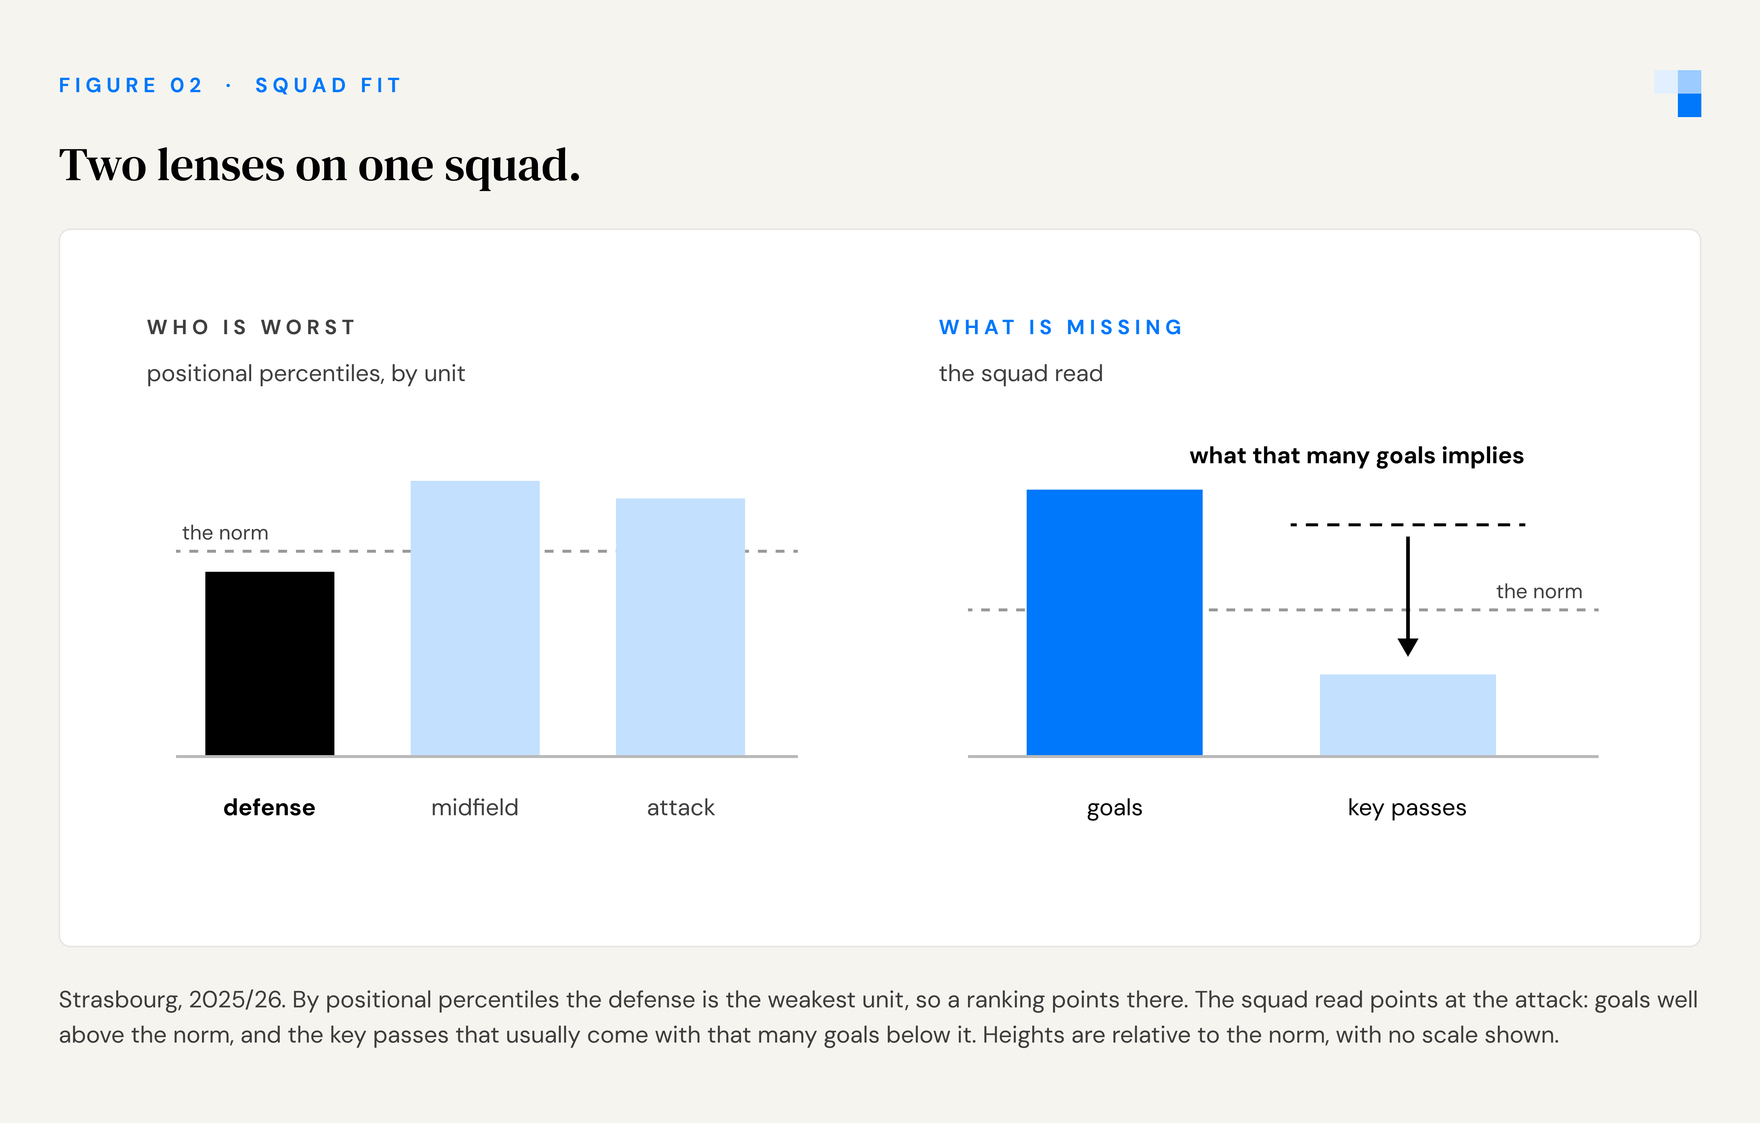
That reversal is the idea behind Squad Fit. The squad decides what candidates should be measured on; the ranking comes afterwards. This piece is about why that order matters and where the hard problems are.
Similarity is easy. Complementarity is not.
Similarity models are common and comparatively simple to build, because they need one player’s profile: find me players who look like him. We build them too. Their catch is structural. A search that starts from a player tends to return versions of that profile, and a squad rarely needs another one. The best partner for a centre-back who dominates in the air, is slow, and is right-footed is usually a quick, left-footed centre-back who is merely adequate in the air, not a second version of the first. Every coach knows that one. The cases that need a model are the ones where the missing quality is not obvious, like City’s tackling and Strasbourg’s chance creation above.
Complementarity needs three things a similarity model does not: the whole squad, which qualities belong together in a coherent side, and how this particular team plays. Others have studied how players combine, mostly by asking whether two players performed well when they shared a pitch. We ask a different question, one that does not need the two players to have met. Given what this squad already does, and how it plays, which quality is it short of, and who has it?
How we read a squad
Across a worldwide pool of team seasons, certain qualities tend to rise and fall together. Sides that create good chances also put shots on target. Teams that keep the ball tend to move it into the final third. Those patterns form a standard, and the first read asks where this squad delivers one half of a pairing but not the other.
The second read is the team’s own game. The standard says what coherent sides do in general. A team’s style says which of those pairings it actually plays through. Together they leave a ranked list of relevant pairings where one side falls short of what the other implies, with the clearest at the top.
Only then do we look at players. Each pairing that falls short points to a position and to the squad’s own players on each side of it, by name, which determines what each candidate is measured on. His level on that quality is a percentile against players in the same position in our data pool, with the search scoped to leagues around the club’s own level. We also ask whether he carries the qualities that usually travel with the missing one, because one half of a pattern is more useful with the rest of it. Where the match data allows, the read also checks whether a pairing happens on the pitch: whose passes reach whose runs, and which connections go unused.
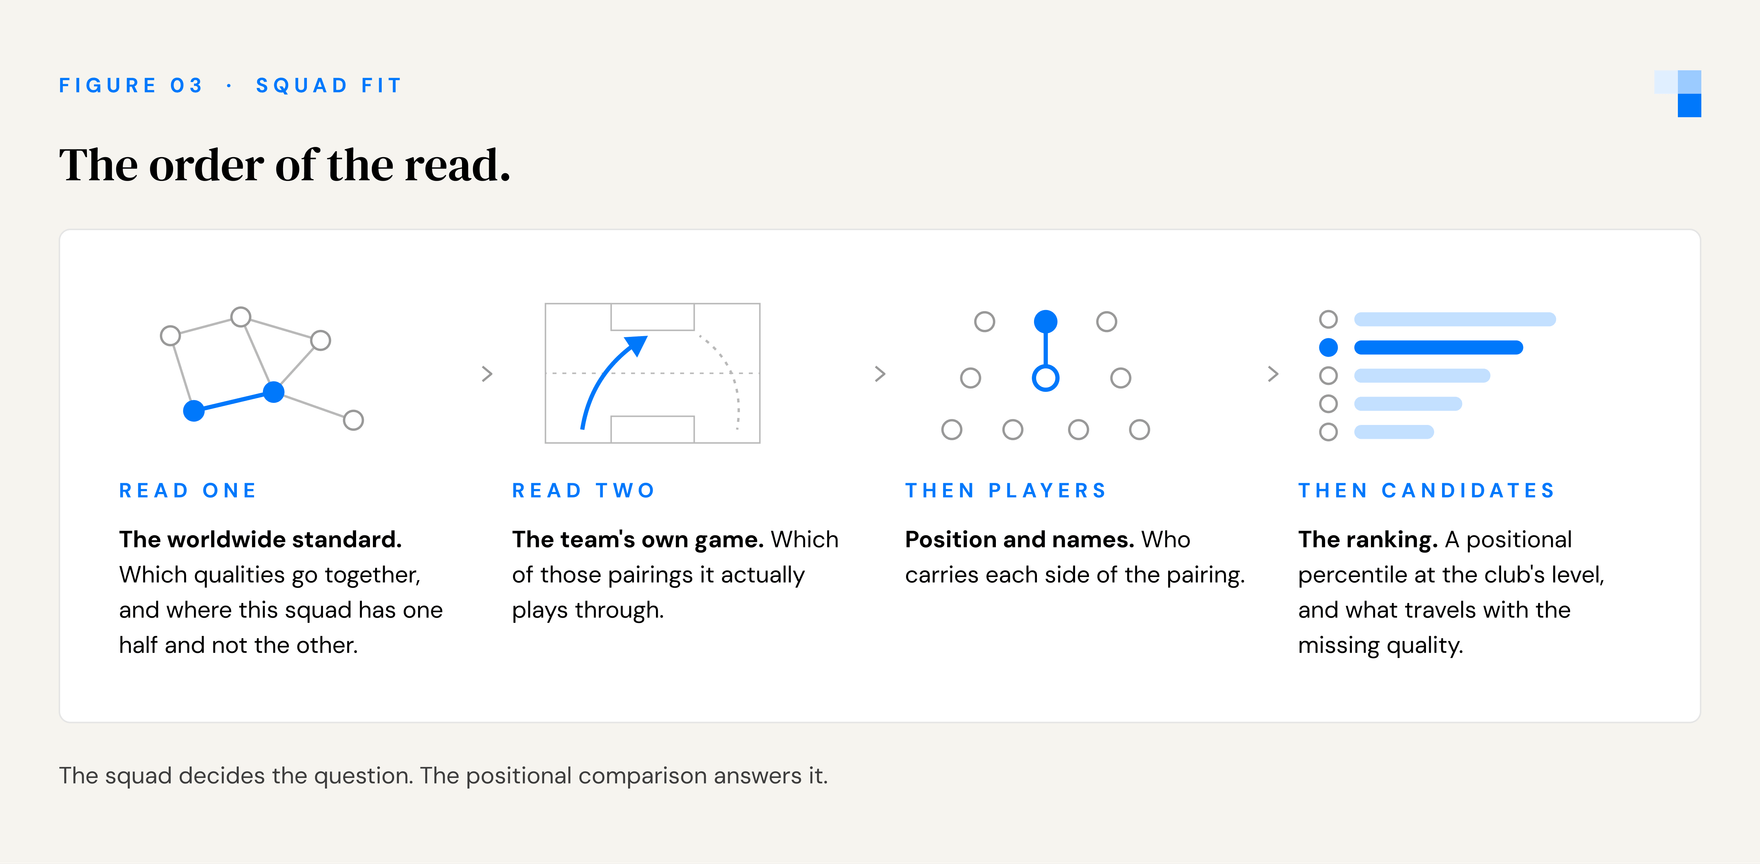
The measurement is positional. The question comes from the squad. Choosing that question is most of the work.
The hard problems
Stronger teams do more of everything. Compare teams side by side and every attacking number seems linked to every other, because good teams rack them all up. We tested for this effect and take it into account, so the pairings reflect how sides are built rather than how good they are.
Style. A side that never crosses should not be told it lacks a target man, however tightly the standard pairs crossing with aerial presence. Separating “we choose not to” from “we cannot” is the most useful thing a squad read can do, and it is why the team’s own game is read alongside the standard, not after it.
Imbalance is not the same as lack. The read is relative. It judges the weaker side of a pairing against what the stronger side implies, so a squad that is below standard on both sides can still be flagged, with the weaker side named. It does not say “you are weak here.” It says “given what you do on one side, the other lags.” Absolute level comes from the positional ranking, and the two should be read together. For a very strong squad, many flags are of this kind: less elite than your best pairing, not poor.
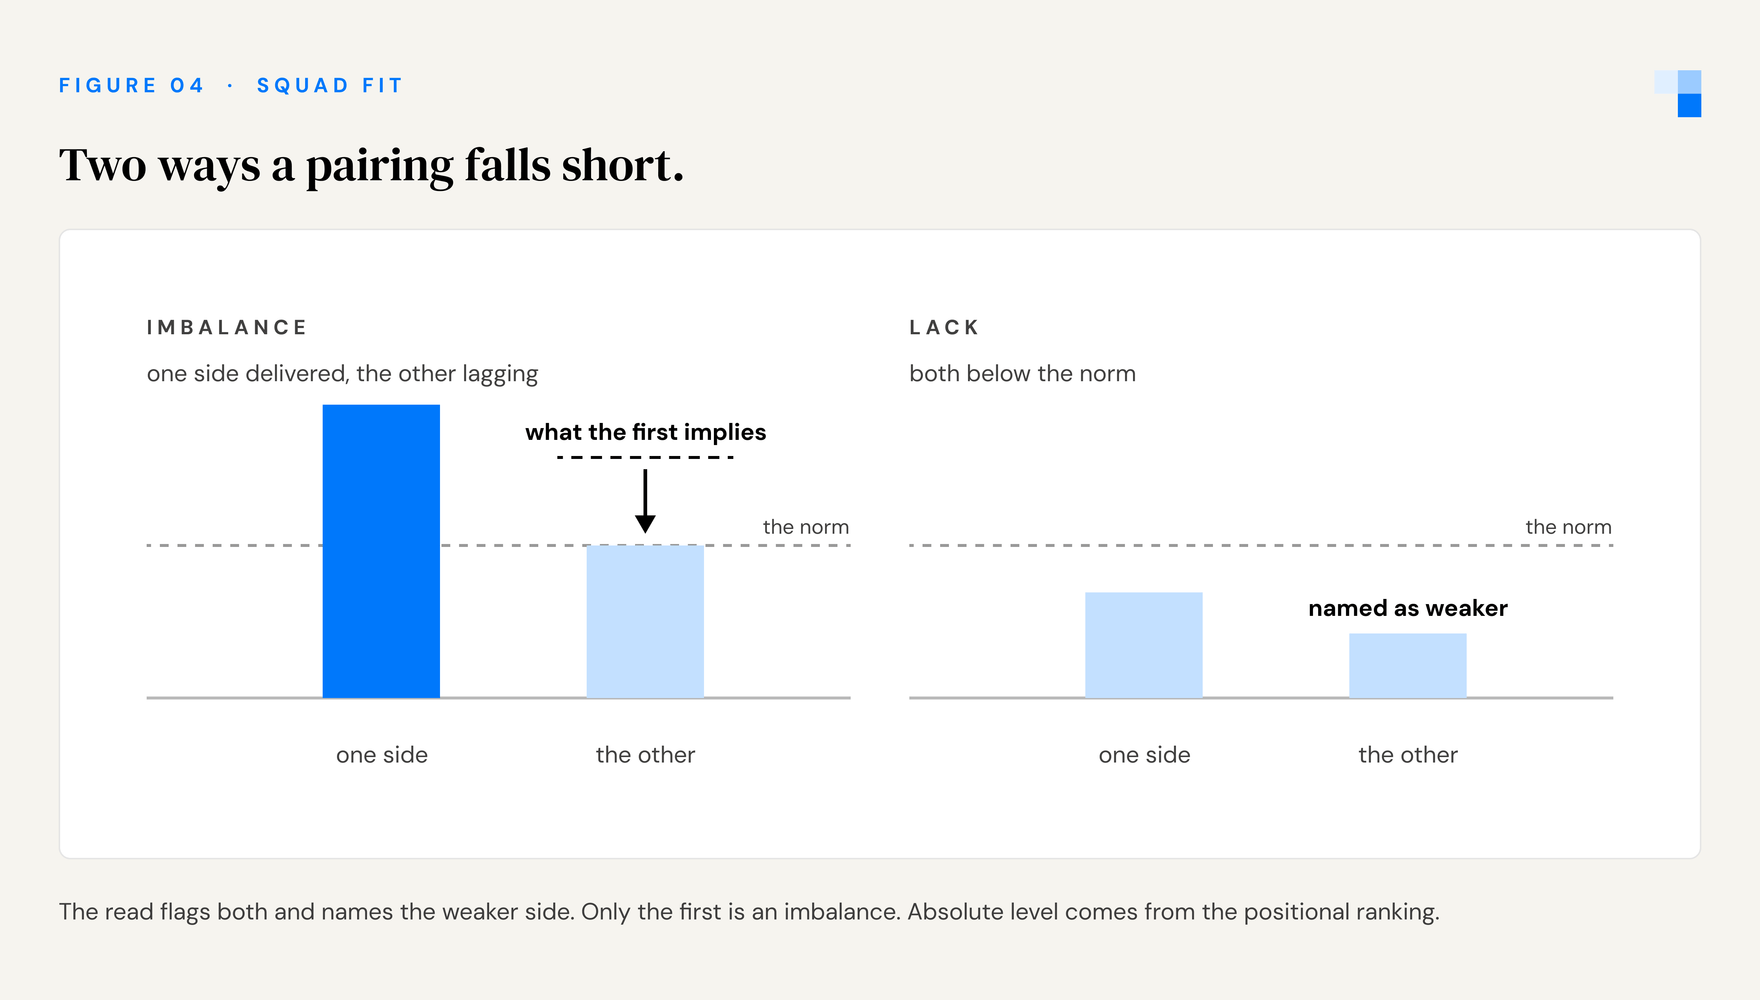
Team level and player level. The read describes what a player adds where the squad is short. It does not estimate how signing him would change the team’s overall numbers.
What leaves
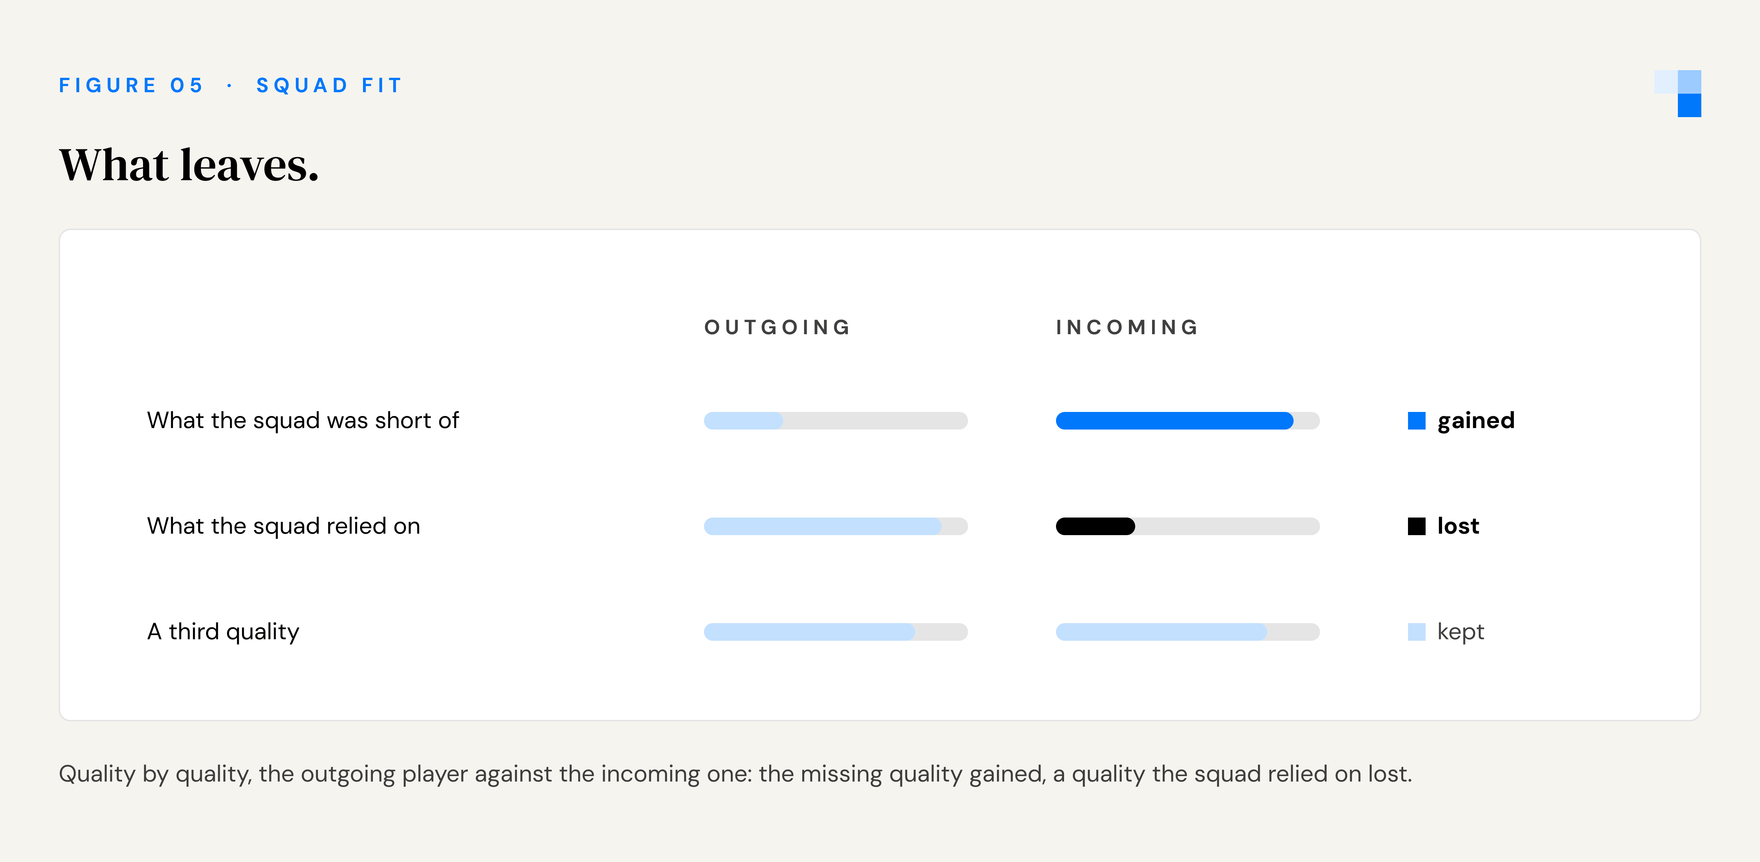
A signing usually replaces someone, and what the squad loses matters as much as what it gains. So the read also runs the other way, showing the qualities the outgoing player carried at a higher level than the incoming one. That trade-off should be visible before anyone discusses a fee. The same read can also be run with a player removed, showing whether a departure changes the squad’s question.
One squad, read three ways
The Valencia example uses the 2025/26 season and is built from event data alone, with nothing from inside the club.
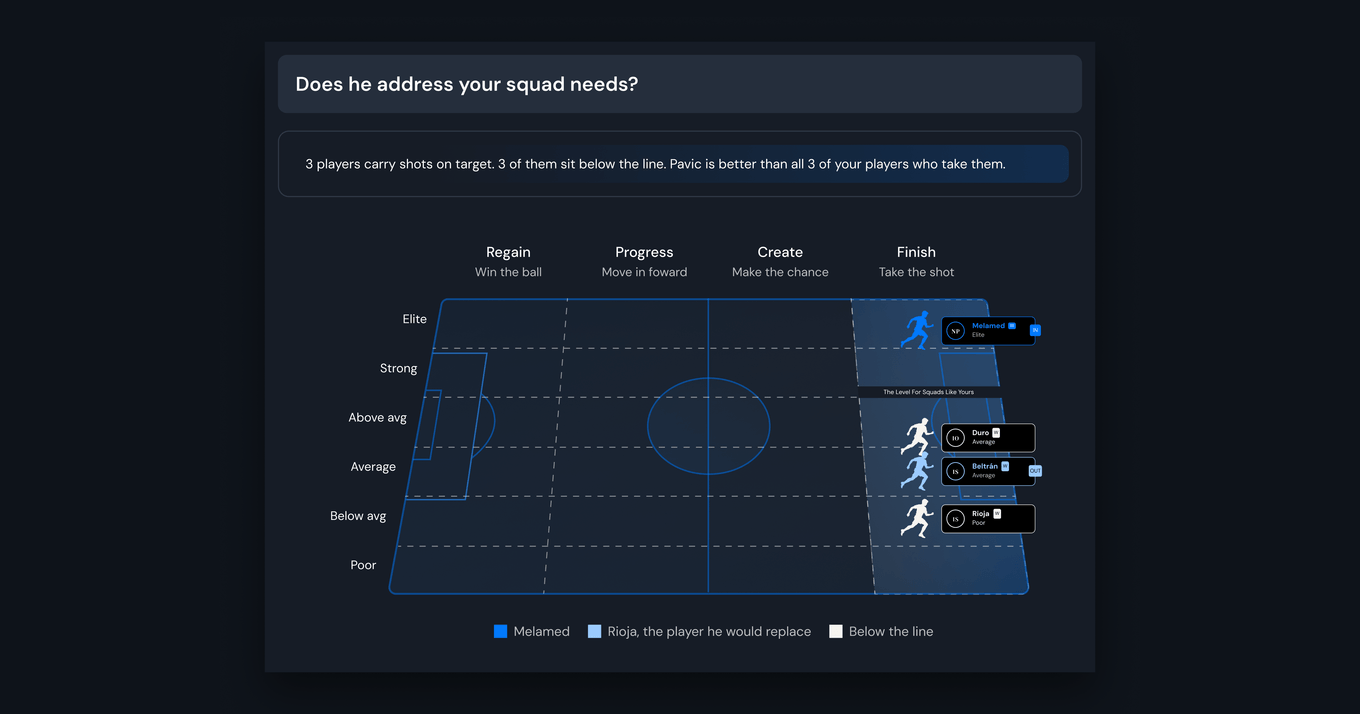
The squad read is clear on one pairing. Valencia create chances at the norm for their level. Filip Ugrinic sits well above it as a creator, Luis Rioja and Andre Almeida above it, Javi Guerra and Arnaut Danjuma at it. What happens to those chances is another matter: no side in La Liga put a smaller share of its shots on target, and only one managed fewer per match. Rioja, Hugo Duro, Lucas Beltran and Diego Lopez, four of the five most-used forwards, all sit well below the norm for their position on shots on target. Sides that create chances at Valencia’s rate put far more of them on target. Valencia deliver one side of the pairing but not the other, and the read names both.
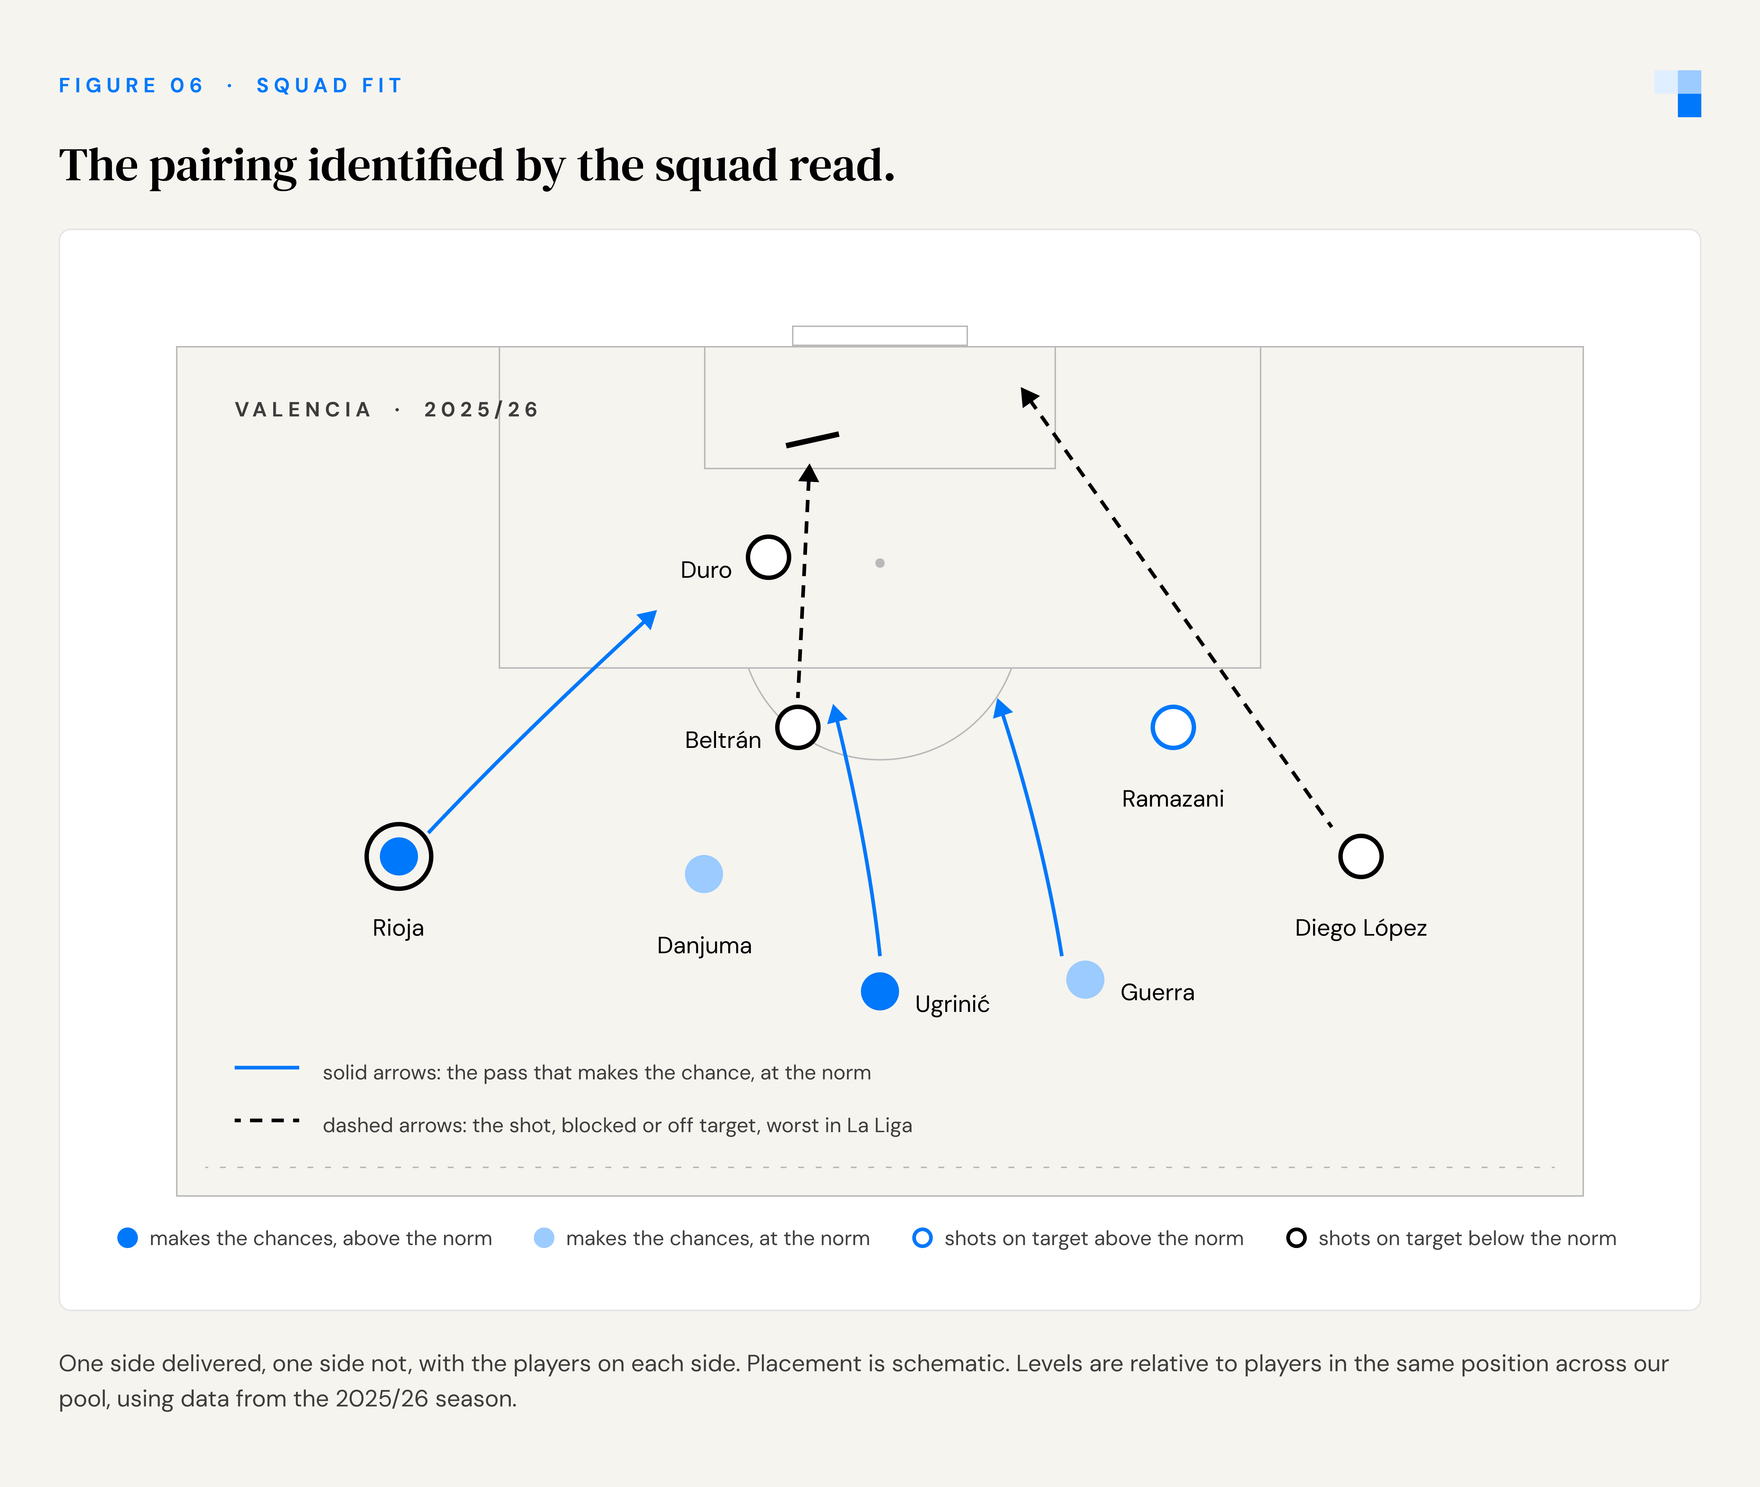
Why does a side with ordinary chances hit the target so rarely? Not for lack of shooting, and not from bad positions: shot volume and shot location are both ordinary for the level. The shots do not reach the goal. Valencia had more shots blocked than any side in La Liga, and even the shots that got past a defender hit the target less often than any side’s. Nor is it one player’s habit. The three most frequent shooters took barely more than a quarter of the shots, and the pattern runs through the squad: more than half of Rioja’s shots were blocked, as were two in five of Beltran’s and Diego Lopez’s shots.
This is a relative flag, and that distinction matters: Valencia’s creation is average for the level, not strong. The read does not say the chances are good. It says that a squad creating chances at that rate should be putting far more of them on target, and it is the one pairing where Valencia fall short by a distance. It is also the one thing the read is emphatic about at Valencia: the next several pairings it lists all point at the same lagging side, shots on target.
The question the read produces for Valencia, then, is who gets more of the squad’s shots through and on target, from the chances it already creates. Here it is answered three ways, with the ordinary filters a club would apply, European leagues around Valencia’s level, an age band and a full season’s minutes. The model applies no feasibility screen: the ranking is on fit, and feasibility sits with the club.
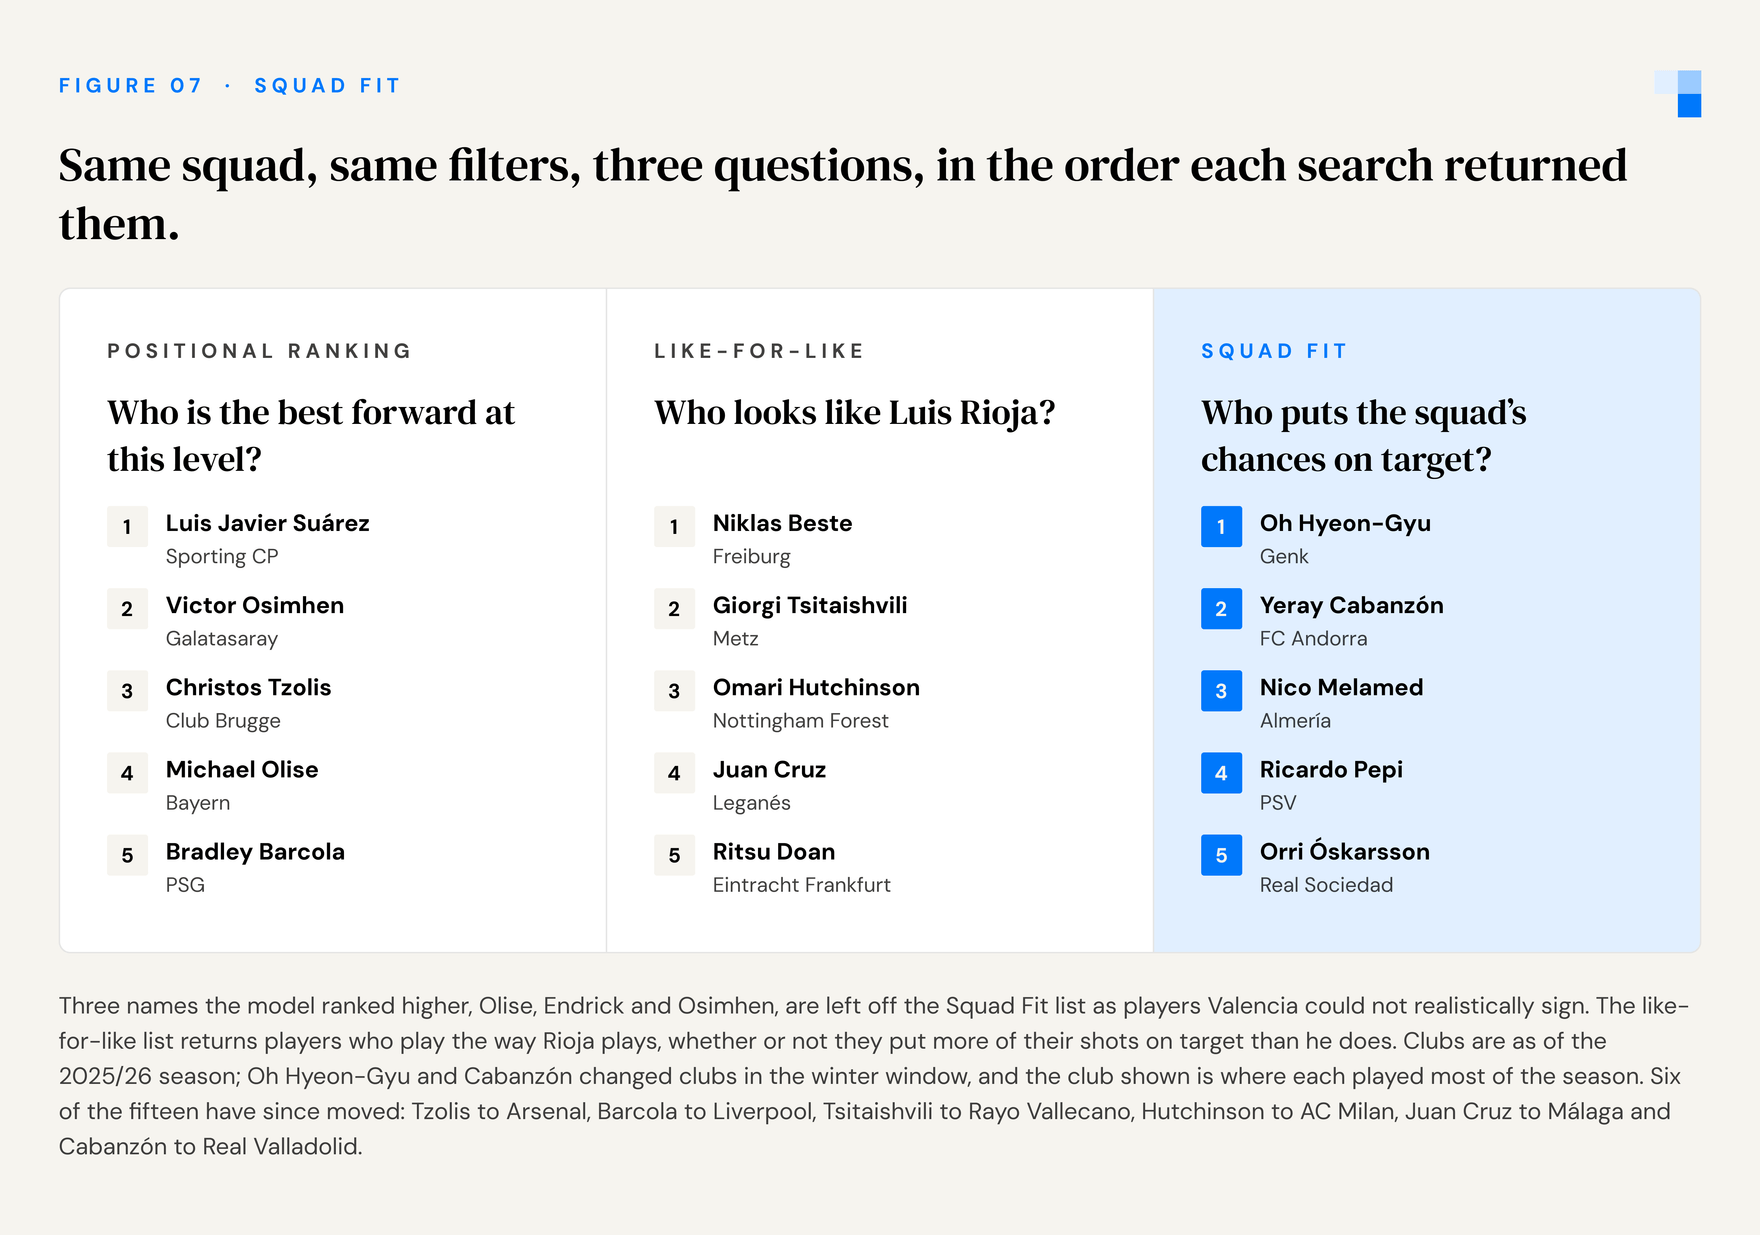
A plain positional ranking, the best forwards at the club’s level by goals and chances created, returns Luis Javier Suarez, Victor Osimhen, Christos Tzolis, Michael Olise and Bradley Barcola. Some are not realistic recruitment targets. It answers a different question: “who is best?”
A like-for-like search, starting from Rioja, returns Niklas Beste, Giorgi Tsitaishvili, Omari Hutchinson, Juan Cruz and Ritsu Doan. They play the way he plays. That search does not ask whether they put more of their shots on target than Rioja does; as it happens, the answer runs from barely to comfortably. A search that starts from the incumbent returns the incumbent’s profile, not the quality the squad was short of.
Squad Fit, ranking on the shots-on-target side of the pairing, returns Oh Hyeon-Gyu, Yeray Cabanzon, Nico Melamed, Ricardo Pepi and Orri Oskarsson, once Michael Olise, Endrick and Victor Osimhen are left off, as a club would leave off players it could not realistically sign. The difference is what each list is ranking on. The first wants the best forwards, and every name on it scores at the top of its position. This one wants the quality Valencia are short of, and the qualities that usually travel with it, so it surfaces Cabanzon and Melamed, wingers from the Spanish second tier whose goals are ordinary but who shoot often and put their shots on target at the top of the position.
Three of the squad’s attackers have since left: Lucas Beltran to River Plate, Largie Ramazani to Burnley and Andre Almeida to Racing Santander. Run the read again without them and the pairing still falls short. Creation barely moves. Shots on target fall further, because Ramazani, who took more shots than anyone in the squad, was also the one forward who put shots on target at a rate well above the norm.
What the evidence can support
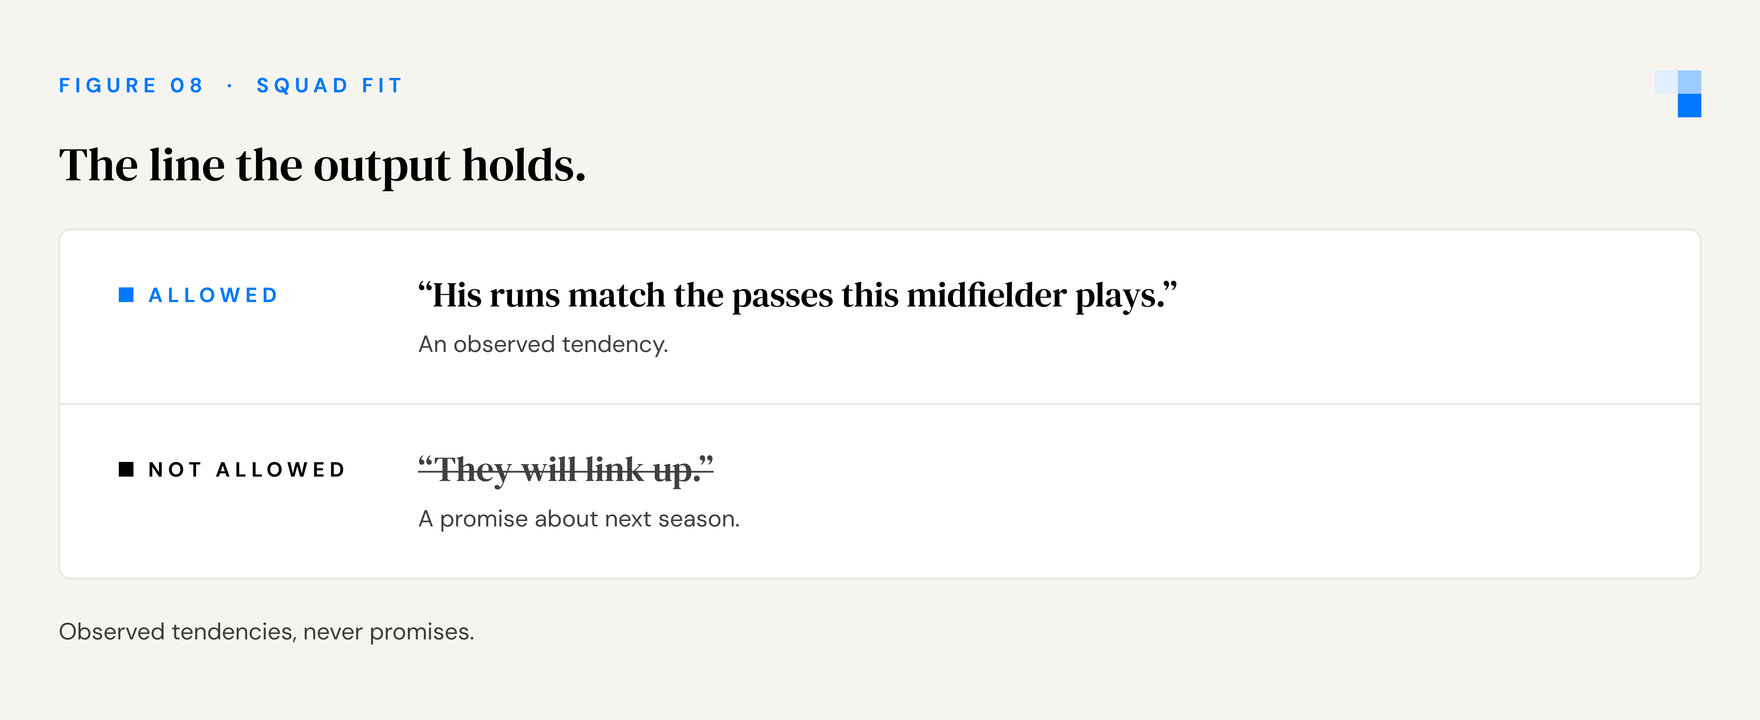
Everything above describes the 2025/26 season: what this squad delivered, what it did not, and what a candidate showed elsewhere. It does not predict what a signing will do next season, with a new coach, a different role, and teammates who respond to him. We keep that distinction explicit in the wording: a statement about an observed tendency is allowed, and a promise that two players will combine is not, even when the promise would make the better sales pitch. For a recruitment decision, that is the difference between evidence and a story.
Squad Fit
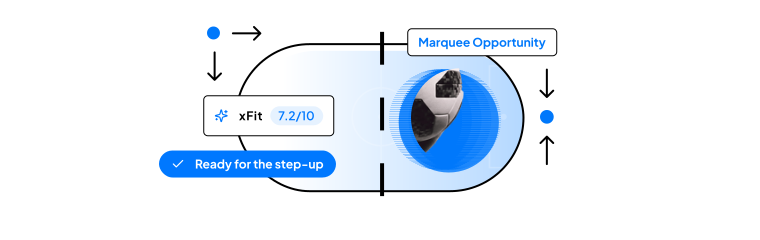
Squad Fit is the name for the question: which qualities this squad is short of, given what it already has and how it plays, and who has them. The reasoning described here, together with the model behind it, is one of several inputs into our proprietary xFit (Expected Club Fit) score. The squad read comes first and says what is missing and who carries it. The ranking comes second and says who has it, at the club’s level, with the qualities that usually come with it. For a recruitment team, xFit is a first filter on where the deep work goes: it answers whether a player is relevant to this squad in seconds, so the hours of video, the live viewings and the decisions that follow are spent on candidates who answer the question the squad actually asked. The shortlist is a better starting point for the scouts, not a replacement for them.
About Marquee
Marquee turns football data into decision-ready insights in seconds, unifying external and internal data and filtering it through each club’s sporting DNA. Professional clubs use Marquee for recruitment, squad planning and analytics. Learn more at themarquee.ai.